Initiatives
These projects focus on the interface between students’ and instructors’ experiences with academic technology and how these experiences impact learning processes in both face-to-face and digital contexts. We come to work each day committed to uncovering new evidence, patterns, or insights into the learning and teaching experience at the University of Maryland, knowing that statistical trends that we uncover likely yield important implications for the students and faculty whom we serve. While we love data we also recognize its limitations and the importance of recognizing the context within which the data are collected. We believe in diversity, both in the traditional sense and the broader sense of thought, perspectives, academic disciplines and problem solving, such as those unique perspectives brought by members of our teams having lived all over the world.
There are many ways to understand the student and faculty experience with the academic technology tools and services offered by the university. The projects below are a representative glimpse of some of the Division of IT's efforts in this area (see a timeline of our survey efforts), with the goal of informing the overall student and faculty experience at UMD (and knowing that technology is just one element of a student or faculty member’s day).
Annual EDUCAUSE Survey
Every spring, the professional organization EDUCAUSE develops an international survey about the student experience with IT on higher education campuses (and biennially for faculty). The Division of IT administers it on their behalf to UMD students and faculty and are able to analyze the UMD data. From these surveys we learn information that helps the Division of IT understand more about student and faculty technology use and needs, such as that, in 2025, 64% of students are satisfied with technology services and support at UMD. Check out the latest EDUCAUSE survey results!
Generative AI in Teaching and Learning
The 2023-2024 academic year represented the first full year in which Generative Artificial Intelligence (GenAI) tools were readily available for use across the entire campus community. We conducted field interviews on campus to gain a baseline understanding of students’ and instructors’ familiarity and use of GenAI tools within academic and instructional contexts. These interviews informed the development of surveys that were administered to UMD students and instructors in Spring 2024, a collaborative project spearheaded by Academic Affairs in partnership with the Division of Information Technology (DIT). Explore the findings from the GenAI survey!
Exploring the Student, Faculty, & Staff Experiences During COVID-19
Students, faculty, and staff at the University of Maryland, College Park were invited to complete surveys on their transitions to online learning, teaching and working in Spring 2020 and Fall 2020 as well as their experiences returning to in-person during Fall 2021 to inform planning, training and outreach. The survey administration, analysis and reporting was a collaborative effort, involving many units across campus. UMD community members can learn the main themes that emerged in the reports of the Fall 2021 student and instructor surveys.
Read highlights about the student experience, instructor experience, academic preparedness, and instructional innovations.
Read the text-only versions of the student experience highlights (text-only), instructor experience highlights (text-only), academic preparedness highlights (text-only), and instructional innovations highlights (text-only).
Technological Readiness for Learning/Teaching Remotely Survey
In March 2020, faculty, staff and students at the University of Maryland, College Park were invited to complete the Technological Readiness for Learning/Teaching Remotely Survey in anticipation of the university transitioning to remote learning/instruction due to COVID-19. The survey included sections on access to technology outside of the University of Maryland, College Park campus, familiarity with and use of the ELMS-Canvas platform and demographic information. The goal of the survey was to assess the readiness of students, faculty and staff for online learning and instruction, including identifying potential challenges and issues that could affect the academic experience.
Read the full report for a blast from the past. Take a moment to reflect on what you've learned since March 2020 and what you still want to learn about online teaching, learning, and research.
Learning analytics is a relatively new field, related to educational data mining, often defined as the “measurement, collection, analysis and reporting of data about learners and their contexts, for purposes of understanding and optimizing learning and the environments in which it occurs” (Learning Analytics and Knowledge Conference, 2011). We focus on university-wide trends, in order to inform business and training decisions, as well as course- and program-level analytics. The intended result of our work is to create and maintain state-of-the-science program evaluation and assessment models. To achieve this goal, we build interdisciplinary teams and collaborate with faculty, researchers and administrators across campus.
University-wide analytics
To more broadly understand the student and faculty experience with academic technologies on campus, we examine university-wide patterns. The technology we investigate the most is our Enterprise Learning Management System (ELMS), Canvas, often known as ELMS-Canvas. For instance, we found out that over 30,000 of students access ELMS-Canvas on average each day during the semester! Read the Fall 2023 Systems & Services report to learn more about university-wide trends for ELMS-Canvas, Zoom, and Panopto (any many other academic technologies!).
Partnerships
Our researchers love engaging in course and program-level partnerships. These partnerships allow instructors to practice data-driven instruction and helps contextualize some of the messy, learning technology data that informs the creation of meaningful metrics.
Scott Moses | Senior Lecturer | pmoses1@umd.edu
As the English Department’s Blended and Online Coordinator for the Professional Writing Program, Scott and ATEX together examine the relationships among course design, learning outcomes and activity in the ELMS-Canvas platform. The Professional Writing Program within the English department fulfills a General Education requirement, serves approximately 7,000 students per academic year and is offered in both face-to-face and asynchronous online formats. The eventual goal of this partnership is to create metrics while taking into account the natural variation across instructors and course formats, also keeping in mind that most of the writing and learning processes take place offline.
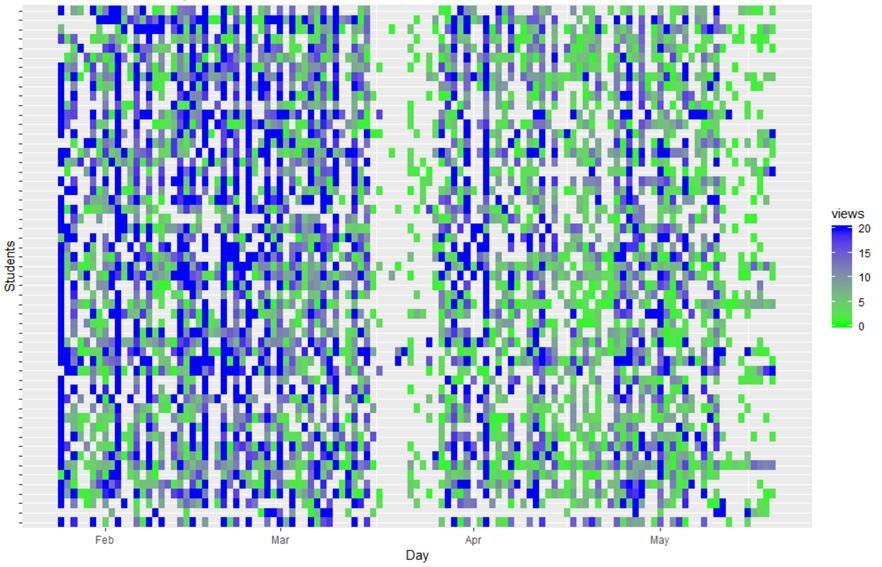
For instance, we developed the heatmap below to understand how students were interacting with the online course space. Each row represents a student, each column a day of the semester, and the color represents the number of course page views for a student on a give day (no color means no page views). Can you tell when Spring break was? Read out academic publication, The positive impact of deliberate course design on the student learning experience and performance, to find out more!
Tracy Tomlinson, PhD | Senior Lecturer | ttomlin1@umd.edu
As a lecturer and researcher in the Psychology department, Tracy and ATEX investigate individual differences in cognitive learning processes in students and if these are related to ELMS-Canvas behavior and learning. Other avenues of exploration include comparing compressed instruction time (i.e., winter and summer courses) to the full semester and comparing face-to-face and online formats. We presented preliminary results of this IRB-approved research project at the 2018 Psychonomics Conference (an annual conference for people who study cognitive psychology).
It has been said that “data is the new oil” (a quote often attributed the British mathematician Clive Humby). And like oil, data can be challenging to extract and needs to be refined into a usable form before it can truly power insight and innovation. Unlike oil, however, data is an ever increasing resource. We employ data science / data engineering techniques and tools to help prototype the analytic pipelines needed to take advantage of the University’s data reserves.
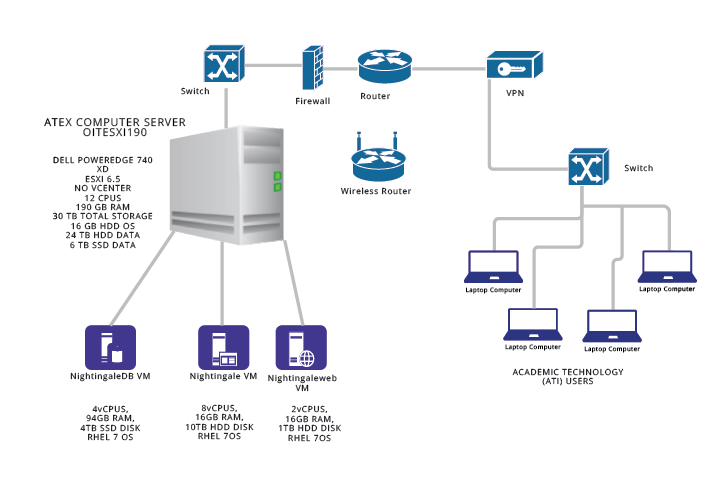
Our recent focus has been creating a pipeline for our Enterprise Learning Management System (ELMS-Canvas) data to support our learning analytic work. Over time, this workflow has moved from laptops to an on-premises server and is now transitioning to a cloud-based infrastructure. Our vision is to responsibly provide University partners and stakeholders with timely data in a secure environment to enable data-informed decision making.
We have worked with others within DIT to build the server structure below as a prototype for storing and processing terabytes of data from ELMS-Canvas! However, we try to be agile and responsible to ever-changing analytics and security needs, so who knows how we will access this data in the future.