
Evolving views on learning modalities
Two years ago, UMD’s participation in the 2022 EDUCAUSE survey marked its first since the move to online learning in 2020, and the return to in-person learning in 2021. Every EDUCAUSE survey since has provided vital information regarding student preferences around learning modalities, and the result at UMD has been consistent: students prefer in-person courses. The current survey offers new insights into how student preferences in this area have evolved since emergency remote instruction.
Students continue to prefer in-person learning experiences
The majority of students (61%) in 2024 indicated that they personally prefer in-person course experiences; another 23% said they do not have a preference, with only 15% saying they prefer online course experiences.
It may be the case that preferences for in-person course experiences are growing. Figure 15 shows the percentage of students who said they prefer to engage in each listed course activity in-person in 2024 (the “head” of the comets) relative to the same percentages in 2023 (the “tail” of the comets). Data highlighted in red indicate activities for which a greater percentage of students in 2024, compared to 2023, said they prefer to engage in-person (data in gray indicate a greater in-person preference in 2023). Most activities showed increased preferences for in-person, especially instructor lectures (with 75% of students now preferring to be in-person), student presentations (71%), class discussions (71%), and office hours (70%). Two activities for which preferences did not change much were those that students already overwhelmingly preferred the in-person experience, namely, lab or interactive work and group activities.
A number of factors may contribute to this trend, including different experiences with online learning (for example, most current seniors started their undergraduate education online, but all subsequent years were in-person at UMD) and overall online fatigue. Continued gauging of these preferences will provide useful data for disentangling these different explanations.
Compared to 2023, a higher percentage of students say they prefer to participate in live course activities in-person.
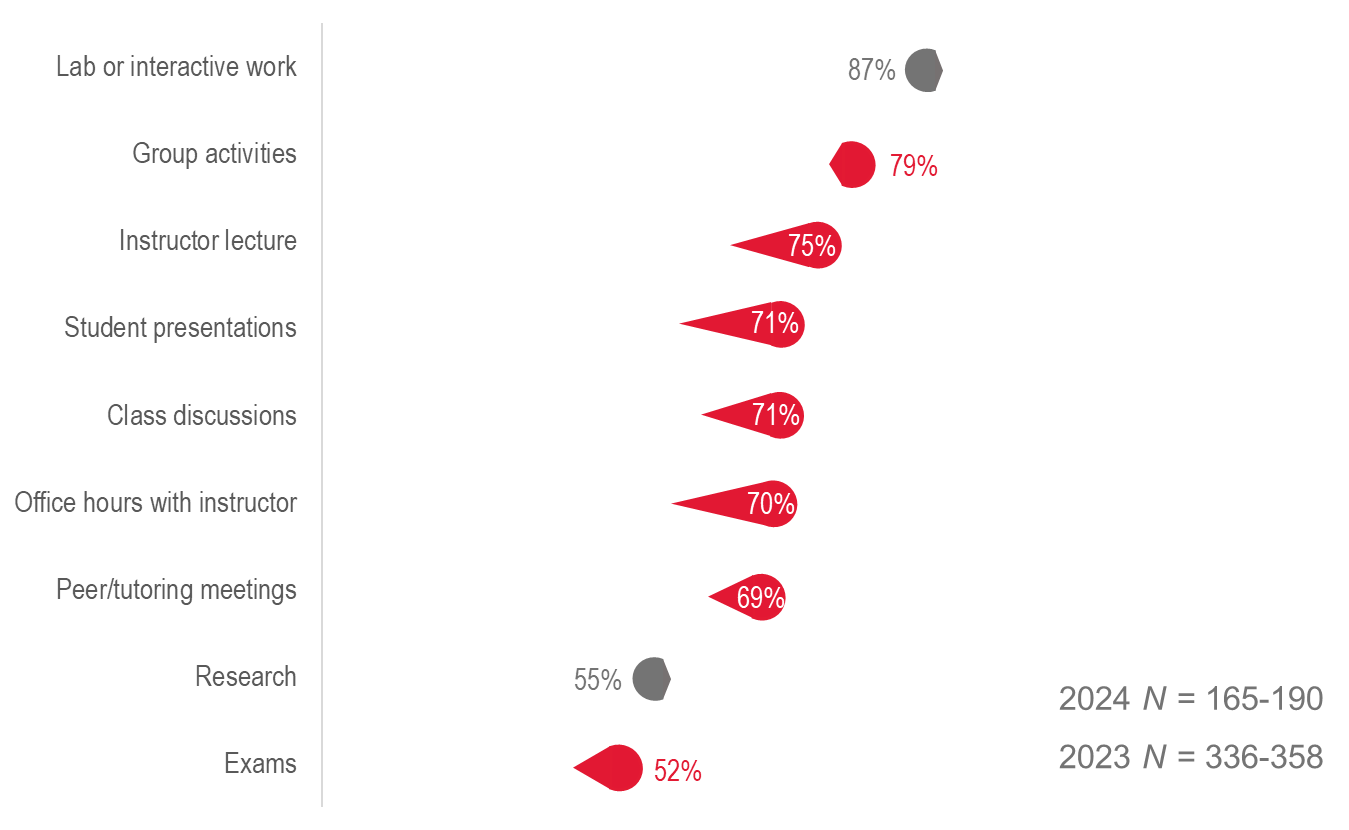
Figure 15. Student responses to the question, “Thinking of your typical course experience, how do you personally prefer to engage in each of the following ‘live’ (synchronous) activities)?” (% selected On-site in the same space with the instructor and/or other students) in 2024 (represented by heads of the comets) relative to 2023 (tails of the comets). Data points in red represent increases in the percentage from 2023 to 2024, while data points in gray represent decreases. Note that the 2023 question did not specify “synchronous”.
Another related trend that we have monitored is the extent to which preferences for in-person versus online learning vary by class year. Consistently, since 2022, we have seen somewhat stronger preferences for in-person learning among first-year students and sophomores compared to juniors and seniors. This trend has continued in 2024 (Figure 16). Although the majority of students in all class years said they prefer in-person learning, those percentages are higher for first-year students (75%) and sophomores (66%) compared to juniors (58%) and seniors or above (55%). The more time passes from the online semesters, the more reasonable it seems to attribute these differences to the specific needs of under- and upperclassmen (e.g., underclassmen wanting to meet new people; upperclassmen living off-campus) rather than their unique experiences with online learning in 2020-2021.
Overall, students from all class years prefer in-person learning, but the preference decreases among juniors and seniors.
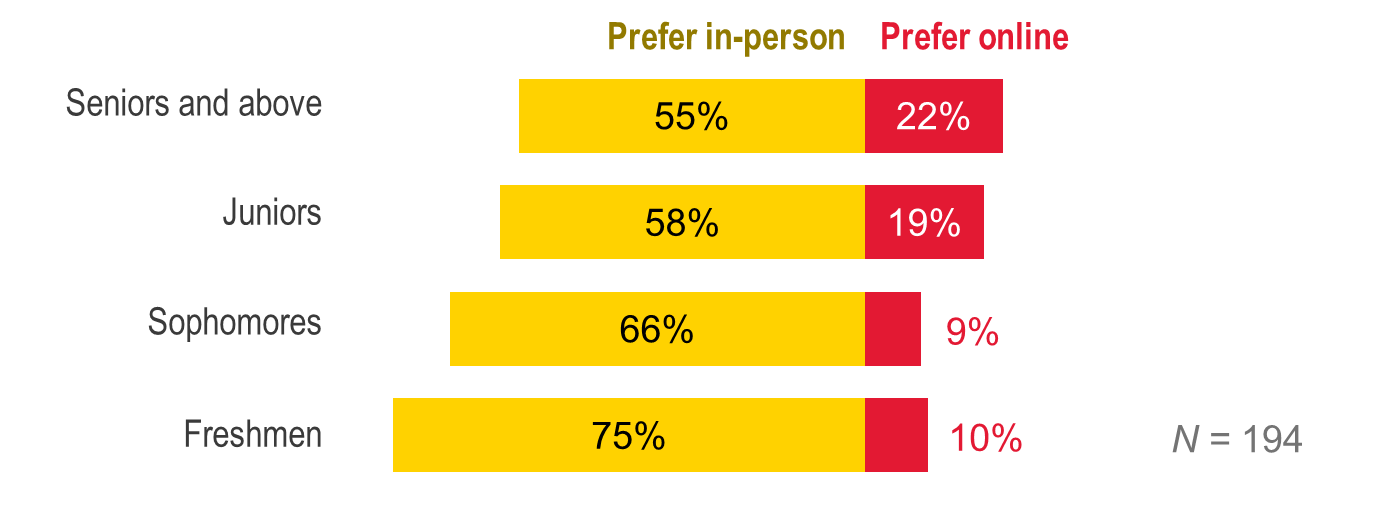
Figure 16. Student responses to the question, “Which of the following best describes your course modality preferences?” broken down by class year. In yellow, the percentage of students within each class year who selected “I personally prefer on-site courses experiences”; in red, the percentage of students who selected “I personally prefer online course experiences.” Note that a neutral option (“I personally do not have a preference for one modality over the other”) is not displayed in this figure, hence percentages do not add to 100%.
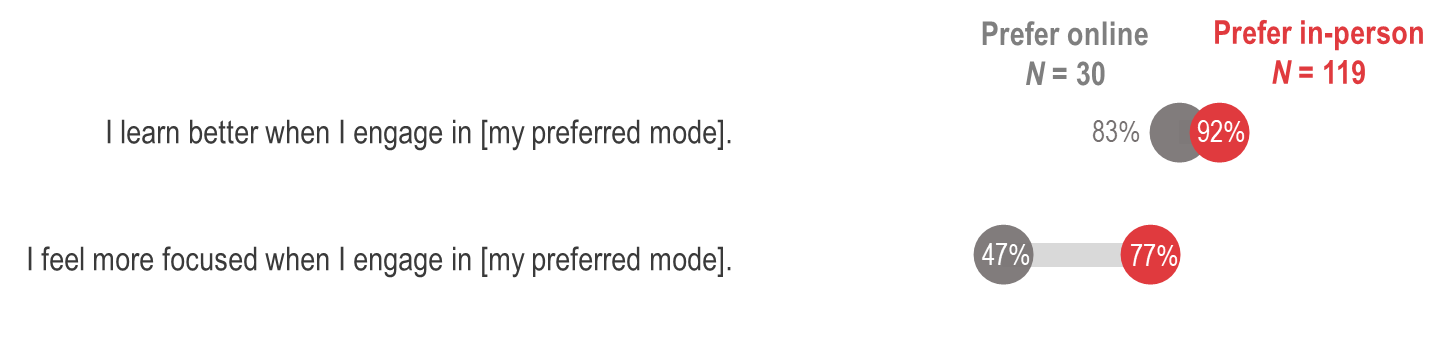
Complementing this analysis, we examined the reasons students cited for preferring in-person learning versus online learning. Although this breakdown resulted in some small n-sizes (because few students preferred online learning), it seems to be the case that these different groups of students cited different reasons for their preferences (Figure 17). Students who preferred in-person learning were more likely to say that they feel more focused in their preferred modality (77%), compared to students who preferred online learning (47%). In contrast, students who preferred online learning were more likely to say that this modality was better for their personal schedule and commitments (70%) compared to students who preferred in-person learning (40%).
Students who prefer in-person versus online learning are more likely to say they learn better and feel more focused in their preferred mode.
Students who prefer online versus in-person learning are more likely to say they feel more comfortable in their preferred mode, and that it is better for their personal schedule, commitments, and disability accommodations.
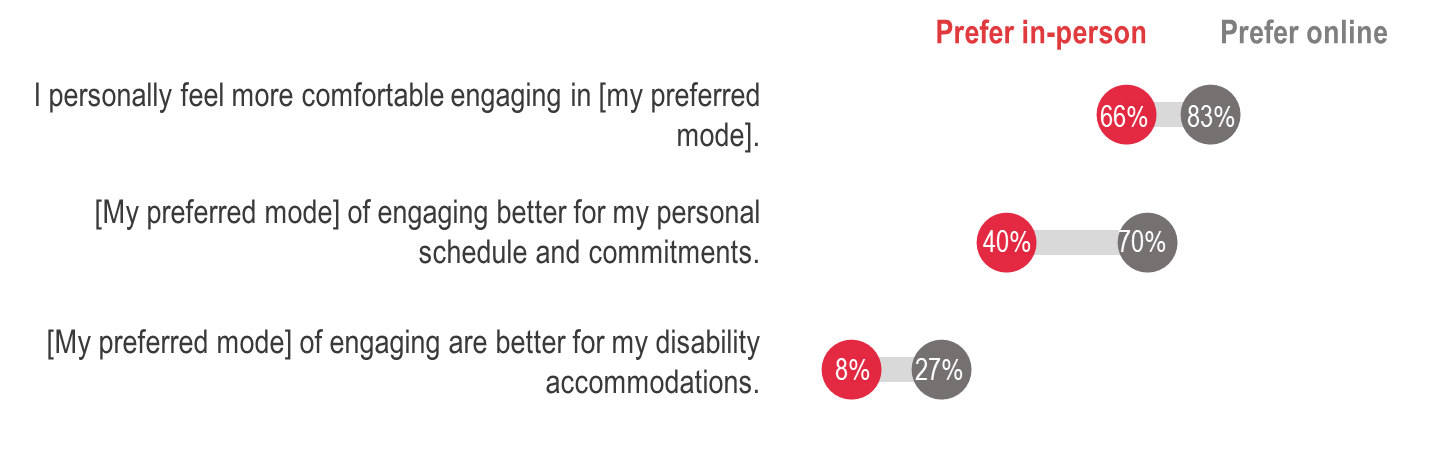
Figure 17. Student responses to the question, “What are your reasons for the course engagement preferences you chose in the previous question (Select all that apply)”, broken down by their responses to the question, “Which of the following best describes your course modality preferences?”. Students who selected “I personally prefer on-site course experiences” are represented in red, while students who selected “I personally prefer online course experiences” are represented in gray. The top of the figure shows reasons indicated by a greater percentage of students preferring in-person courses, while the bottom of the figure shows reasons indicated by a greater percentage of students preferring online courses. Note that where the item stems in this figure say “My preferred mode”, the actual item text read “those ways” (e.g., “I learn better when I engage in those ways”); this was changed in the figure for interpretability.
Personal preferences aside, many students may still favor student flexibility more than anything. Of note, 77% of students agreed that all students should be able to participate in course activities in whatever ways work best for them, and a majority also suggested that certain class activities should be organized such that some students can participate online while others are in-person (office hours: 58% of students; peer/tutoring meetings: 63%; instructor lecture: 54%).
At an in-person institution, of course, there are limits to the flexibility that UMD instructors can afford to students for certain types of activities. Nonetheless, these findings reinforce the value of providing students with online options for meeting with instructors and engaging with course material where possible, particularly accommodating those whose personal schedules and commitments might otherwise impede their ability to do so. Almost 4 in 5 instructors (78%) said they implement flexibility into their courses, but the extent to which this includes online components is not clear. More generally, a higher percentage of instructors reported looking for multiple ways of presenting information and assignments, and accommodating multiple learning preferences and needs, compared to students reporting that their instructors did so (Figure 18), suggesting that there is a potential gap between their perceptions of flexible course offerings.
More instructors say they offer flexible learning and assessment options, compared to students who agree that their instructors have offered these options.
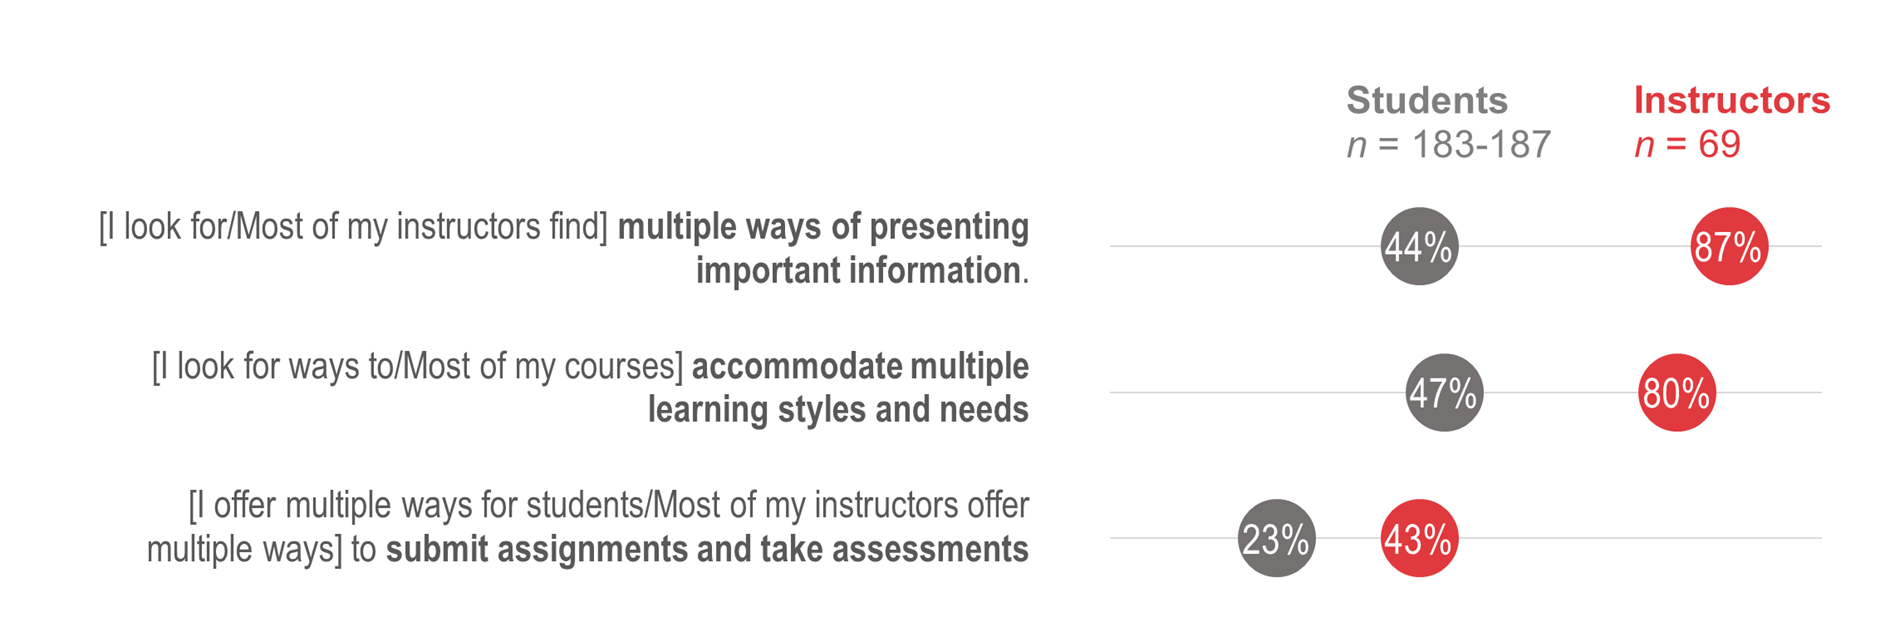
Figure 18. In gray, student responses to the question, “Please rate your level of agreement or disagreement with the following statements.” (% selected Agree or Completely Agree). In red, instructor responses to the question, “Which of the following have you done and/or are you currently doing to make your course accessible to students?”
Instructors prefer in-person teaching
Students’ preferences for in-person learning are mirrored by instructors’ preferences for in-person teaching. Fifty-six percent of instructors said that they prefer to teach in-person, while another 25% said they prefer to teach hybrid courses (although, as the section below explores, their definitions of “hybrid” teaching may vary). Only 8% of instructors said that they prefer to teach a typical course online.
Instructors’ reasons for preferring in-person teaching were not directly assessed by the EDUCAUSE survey instrument. Reasons accounting for in-person teaching preferences may include greater experience in this modality: 85% of instructors said that they have over 10 years of experience teaching in-person, compared to only 16% of instructors who said that they have that much experience teaching online or hybrid courses. However, an additional factor is likely that instructors find it more difficult to engage students online compared to in person. Indeed, 43% of instructors said that they do not believe it is possible to achieve the same level of student engagement online (while 40% said it is, and 17% said that they don’t know).
Interestingly, instructors also said it is more difficult to assess student engagement online, with 85% of instructors saying that it is somewhat or very easy to gauge student engagement for in-person courses, but only 21% indicating the same for online courses. This raises the possibility that, while feeling it is not possible to engage students as much online, instructors also are not sure to what extent students are engaging—-a lack of feedback that, in turn, may further contribute to instructors’ difficulties engaging students. Many of the feedback mechanisms that instructors did say they use to measure engagement (Figure 19), such as direct interaction with students (cited by 97% of instructors) and nonverbal cues/behaviors (86%) may be hindered in an online environment.
Instructors rely on a variety of feedback mechanisms to assess student engagement.
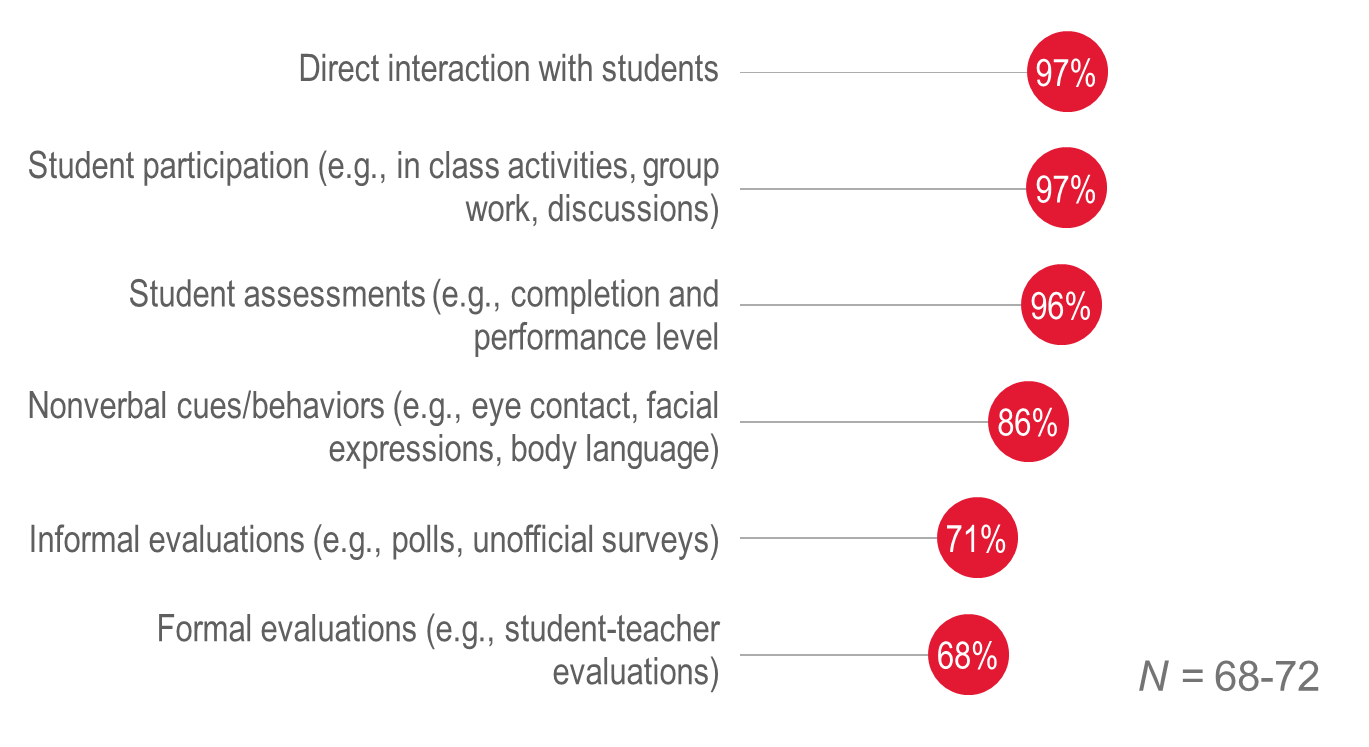
Figure 19. Instructor responses to the question, “Please indicate the extent to which you rely on each of the following to assess student engagement in your courses(s).” (% selected Some or A lot.)
Students and instructors agree that more institutional guidance could be provided related to what constitutes a hybrid course.
Students who had taken hybrid courses were asked about the consistency of their experiences in this modality. Only half (48%) said that hybrid means the same thing across all the hybrid courses they have taken, and only 41% said that instructors follow consistent practices across all hybrid courses.
The lack of consistency in students’ hybrid experiences may, to some extent, reflect a broader lack of clear definitions or expectations regarding how courses should be structured based on their modality at UMD. When asked whether their institution or department had specific definitions and guidelines for what courses should look like based on modality, an equal percentage of instructors said that they did not know as instructors saying yes (38% in both cases). Meanwhile, the remaining 24% said no, possibly showing a discrepancy with instructors who said yes (although it is possible that these represent departmental differences).
Instructors were asked more broadly about the consistency of course structures at UMD as determined by modality; their responses are compared to those of students, regarding hybrid courses specifically, in Figure 20. Fewer than half of instructors thought that there is consensus (42%) or consistency (37%) in how courses are structured and run based on modality, and it seems possible that this could contribute to students’ sense of a lack of consistency in hybrid courses. While this finding does not necessarily prescribe strict definitions at the institutional level (versus allowing instructors some flexibility in choosing how to implement their courses), it may underscore the importance of communicating expectations to students before they enroll. Fifty-six percent of instructors agreed that expectations to students are clearly communicated, as did 81% of students (regarding hybrid courses specifically); these numbers, while majorities, nonetheless imply room for greater clarity in communications about course structures.
Instructors and students both say that there is a lack of consistency regarding how some courses are structured.
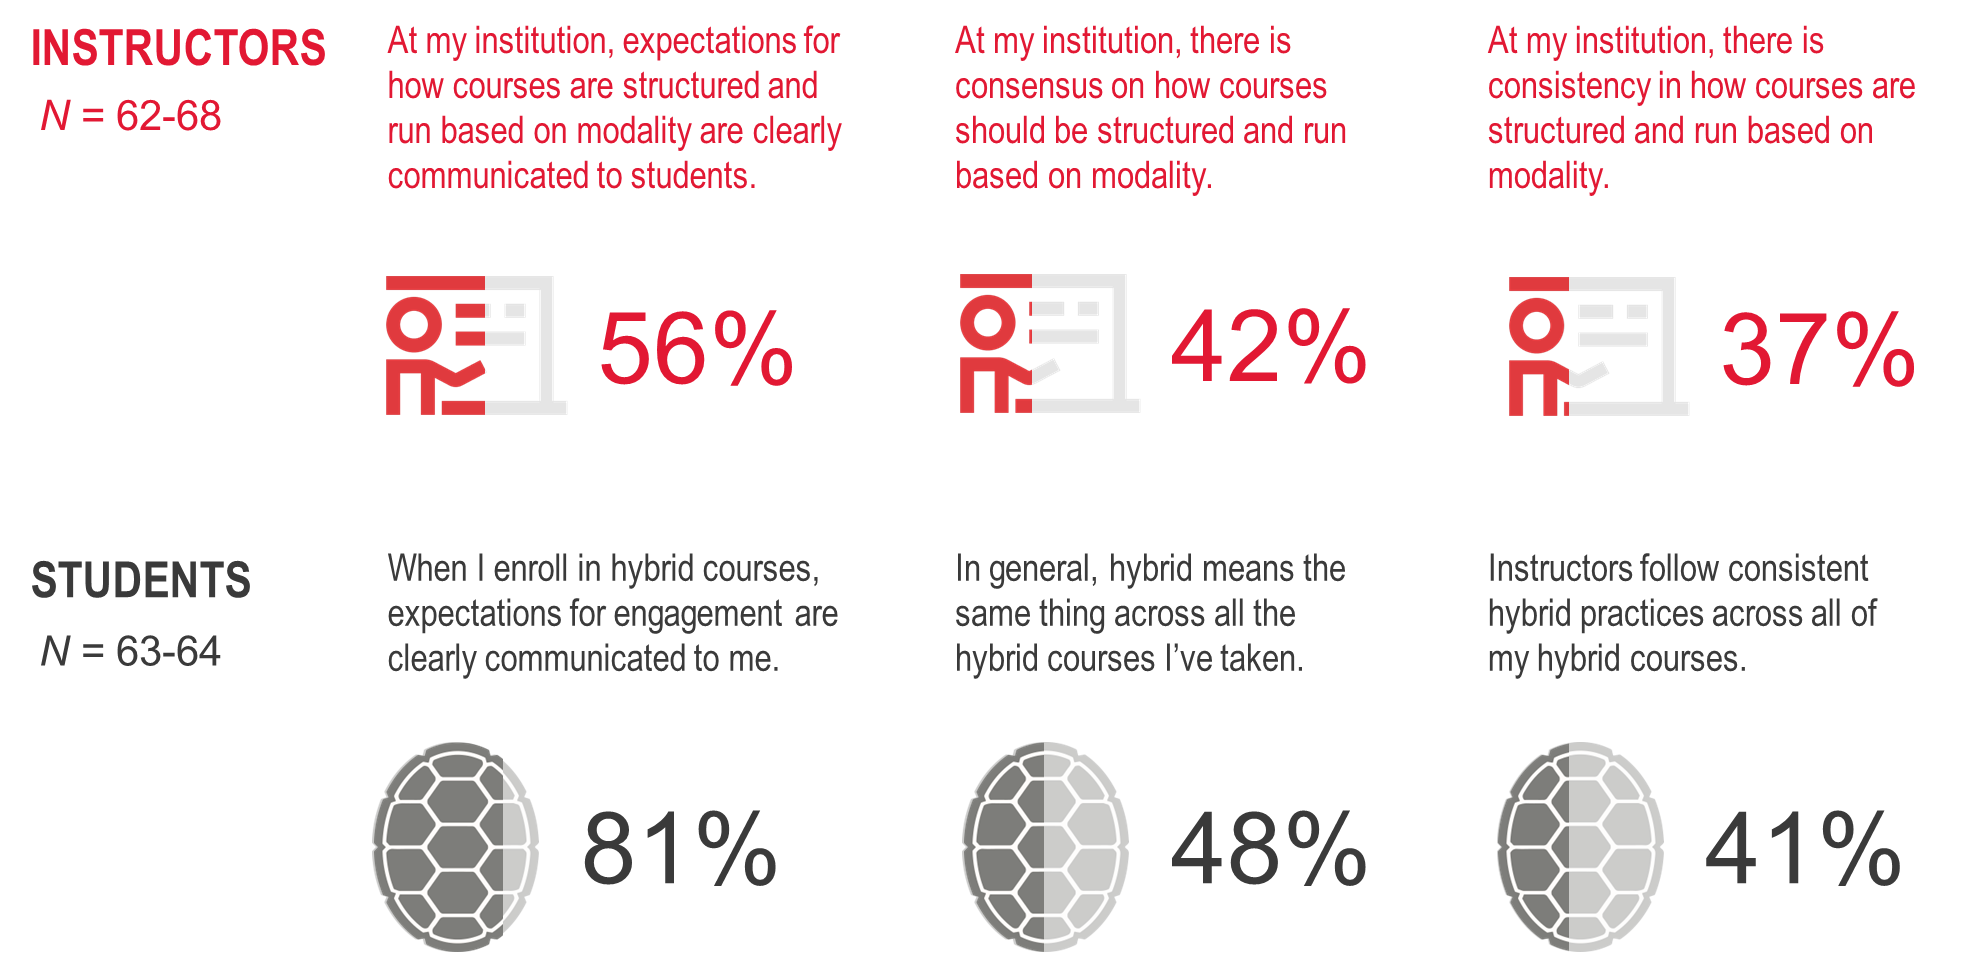
Figure 20. Top: Instructor responses to the question, “To what extent do you disagree or agree with the following?” (% selected Somewhat agree or Strongly agree to each item.) Bottom: Student responses to the question: “Please rate your level of agreement or disagreement with each of the following statements.” (% selected Agree or Completely agree to each item.)